Business owners are often overwhelmed by the amount of information available to them. Sales data may be in a CRM, financial reports in accounting software, customer support in Excel sheets, and day-to-day operations in a variety of other places.
Sometimes the issue is an excess of information; more often than not, it is the lack of appropriate, timely, and accessible information.
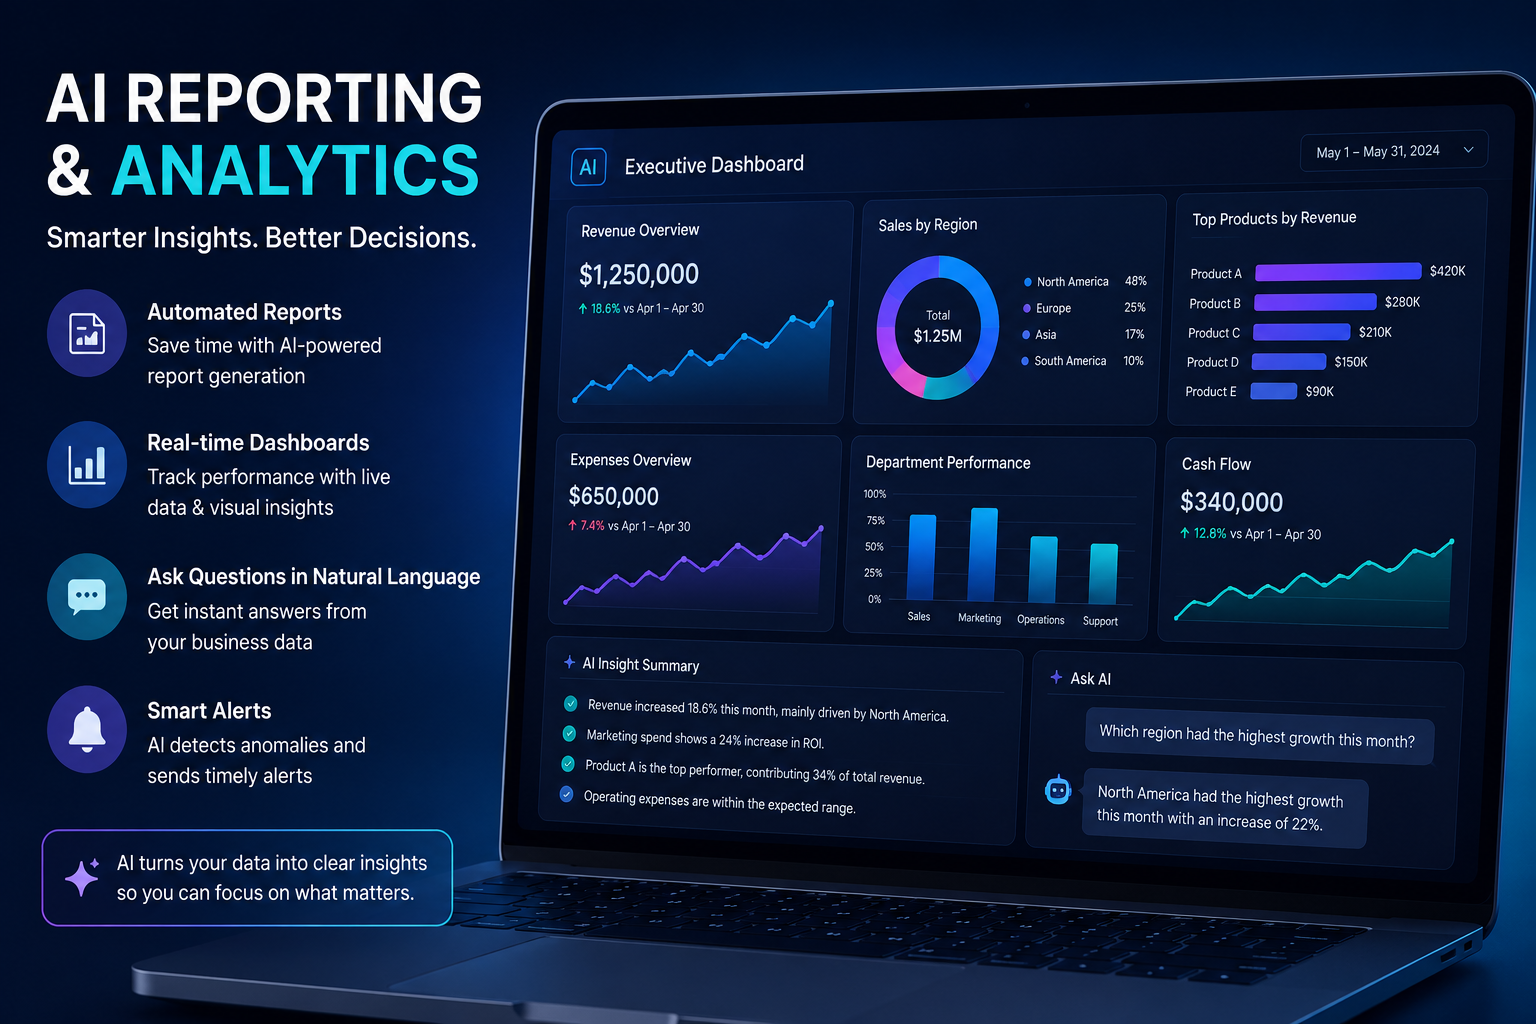
Reporting and analytics solutions driven by artificial intelligence can help business owners and managers to automate the report generation process, identify trends, summarize report content, highlight outliers, and make information more accessible to end-users. Instead of lengthy meetings and discussions about report content, decision-makers can have report summaries, dashboards, report distribution, and natural language queries.
The goal is not to remove the human factor but to reduce the time spent on report preparation and increase the time for decision-making.
The Business Problem:
Data Is Present but Incomplete, Inaccessible, or Too Late Many companies rely on reports generated by employees. Such reports can be in various forms, ranging from queries extracted from databases and processed in Excel to visualizations and summaries prepared for review by management.
Report preparation methods can lead to a number of issues, includinglong report generation cycles,outdated information,different calculations in different departments,a lack of context or supporting information,business owners asking irrelevant questions due to inaccessible data,andhuman error during report preparation.
A business owner may be asked to provide information about the most popular products, customers with outstanding payments, or reasons for rising expenses. Such report content requires information from various sources.
An AI-driven reporting solution can consolidate and summarize this information to make it more accessible to users.
How AI Reporting And Analytics Tools Work
An AI reporting tool can collect information from various sources accessible to the application. These can include databases, CRMs, ERPs, Excel sheets, accounting software, project management systems, or cloud applications. The tool can consolidate this information, calculate relevant metrics, identify trends, patterns, or outliers, summarize reports, provide dashboards, allow report queries in natural language, distribute report content, and store data for future reference. For example, a business owner may request a report on the company’s sales by region for the last three months. The report would extract this information in summary form, statistical tables, or visualizations, depending on the user’s preferences and data sensitivity. Reports with sensitive information may require special access before being viewed or distributed.
Critical Features And Capabilities:
Generating Reports Automatically On A Schedule
Business owners and managers can set up report generation schedules so that reports do not have to be requested and prepared manually. Automated reports can be generated daily, weekly, or monthly and can contain sales summaries, income and expense statements, project progress, inventory status, customer support dashboards, team performance, and more.
Report Queries In Natural Language
Users should be able to ask questions in natural language rather than query reports or design report views. This feature allows business owners and managers to request report information faster without relying on IT support.
Summary And Synthesis Of Long Tables And Dashboards
Long tables or dashboard reports can be difficult to interpret and analyze. The ability to summarize reports or synthesize their content can be critical in some cases, such as identifying trends or patterns. For example, a report summary can indicate that sales in the western region have increased, while the average order value has decreased for two key product categories. Finally, it is for the business owner to decide what action, if any, is required.
Detecting Anomalies, Exceptions, And Outliers
Business intelligence solutions can highlight abnormal values, trends, or outliers in data sets.Some common applications of this feature include identifying revenue shortfalls, unreasonable expenses, project delays, inventory losses, fraudulent activities, customer complaints, or underperforming sales regions or products.
Forecasting And Predictive Analytics For Business
Predictive analytics for business owners can use historical data sets to identify patterns that can be applied to future data. Common implementations include sales forecasts, demand planning, customer attrition, inventory requirements, cash flow projections, and probability of delinquency. In other words, predictive analytics can estimate potential outcomes but should not be used for definitive conclusions.
Reports And Dashboards Tailored To The User
End-users typically have different requirements, so the same report can have different views for different users. For example, a business owner dashboard may display high-level company metrics, while a sales manager needs more details about the sales pipeline, and an operations manager is more interested in process performance.
Key Business Benefits
An effective AI reporting and analytics solution can help tosave time on report preparation,improve access to timely and relevant information,standardize report generation,provide faster insight into potential issues,monitor key performance indicators,reduce the reliance on Excel and manual report preparation,improve report understanding,andenable planning and predictive analytics.The value of such solutions is conditional on the accuracy of the information contained in reports and the relevance of the questions asked. In other words, automatically generated reports that contain incorrect information or are irrelevant to the user will provide limited value. First, it is critical to ensure report accuracy and identify key performance indicators that require additional attention. At the same time, users should ask relevant questions that such reporting solutions can answer.
Real World Applications And Examples
Many industries and businesses can benefit from AI reporting and analytics solutions, including
- Retail and e-commerce
- Financial services and consulting
- Healthcare
- Manufacturing,
- Real estate,
- Educational institutions.
Retail And E-Commerce
Business owners can analyze sales, inventory, customer behavior, profitability, and marketing campaign performance. For example, reports can identify popular and slow-selling products, track inventory turnover, detect irregularities in sales, and optimize marketing budgets, among other applications.
Financial Services And Consulting
Financial reporting, revenue, expense, and cash flow analysis, and risk management are common applications in financial services and consulting. At the same time, financial reports often contain sensitive or confidential information, so such reports may require additional auditing and security measures.
Healthcare
Healthcare providers can analyze appointment scheduling, operational performance, staffing needs, and financial reports. Electronic health records and other personal health information must be handled in accordance with privacy and data security regulations.
Manufacturing
Report automation can be used for production analytics, supply chain performance, equipment maintenance, and utilization reports. This industry often relies on extensive report automation to optimize production and reduce costs.
Real Estate
Real Estate owners can benefit from lead generation reports, property management analytics, occupancy dashboards, customer support summaries, and sales performance reports. In addition, reports can track the most popular property categories and locations and other characteristics relevant to the business.
Educational Institutions
Schools and universities can use report automation for admission analytics, attendance tracking, student performance, and operational performance reports.
General Business Applications
Report automation tools can be used in a variety of industries and functions, including human resources, sales, marketing, customer support, finance, purchasing, and project management analytics.
When Custom Reporting Tools Are A Better Fit Than Off-The-Shelf Solutions
Many small and medium-sized business owners will find that off-the-shelf report automation and analytics tools can address their reporting needs. Such solutions typically provide reporting templates and access to report generation and analytics features. At the same time, these solutions are typically limited to publicly available data or data owned by the companies that develop such solutions.
Custom business reporting software is a better fit when the company needs to consolidate various internal sources of data, has unique calculations,works with sensitive data, requires different levels of user access, needs to deliver different reports to different users, wants to ask natural language questions, needs to integrate report generation and analytics with other tools, has specific audit trail requirements, or wants to embed analytics solutions within a reporting tool.
In other words, custom reporting software can be designed around the unique requirements of a business rather than forcing the company to adapt its reporting and analytics processes to a generic solution.